Training
|
|
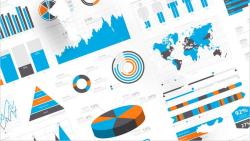
Data Visualization
Data Visualization is the presentation of data in a pictorial or graphical format. It enables decision makers to see analytics presented virtually, so they can grasp difficult concepts or identify new patterns. With interactive visualization, you can take the concept a step further by using technology to drill down into charts and graphs for more detail, interactively changing what data you see and how it’s processed. |
|
|
Big Data |
|
|
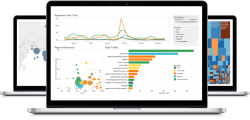
Tableau
Learn how to use Tableau to see and understand your business’s data better. Tableau is a key player in the business intelligence field. These trainings will help you use this program to analyze and visualize your data. |